The Panama Canal: A Vital Link in Global Shipping Routes
TL;DR: The Panama Canal handles 5% of global trade, faces 2025 water challenges from climate change, and remains essential for efficient shipping routes between Asia, Americas, and Europe. Learn key facts, challenges, and logistics impacts.
Panama Canal's Role in Global Shipping Routes
The **Panama Canal stands as a cornerstone of global shipping routes**, connecting the Atlantic and Pacific Oceans since 1914. This 50-mile waterway slashes transit times by up to 8,000 miles compared to Cape Horn routes.
In 2025, amid rising trade volumes, it processes over 14,000 vessels yearly, supporting maritime logistics worldwide.
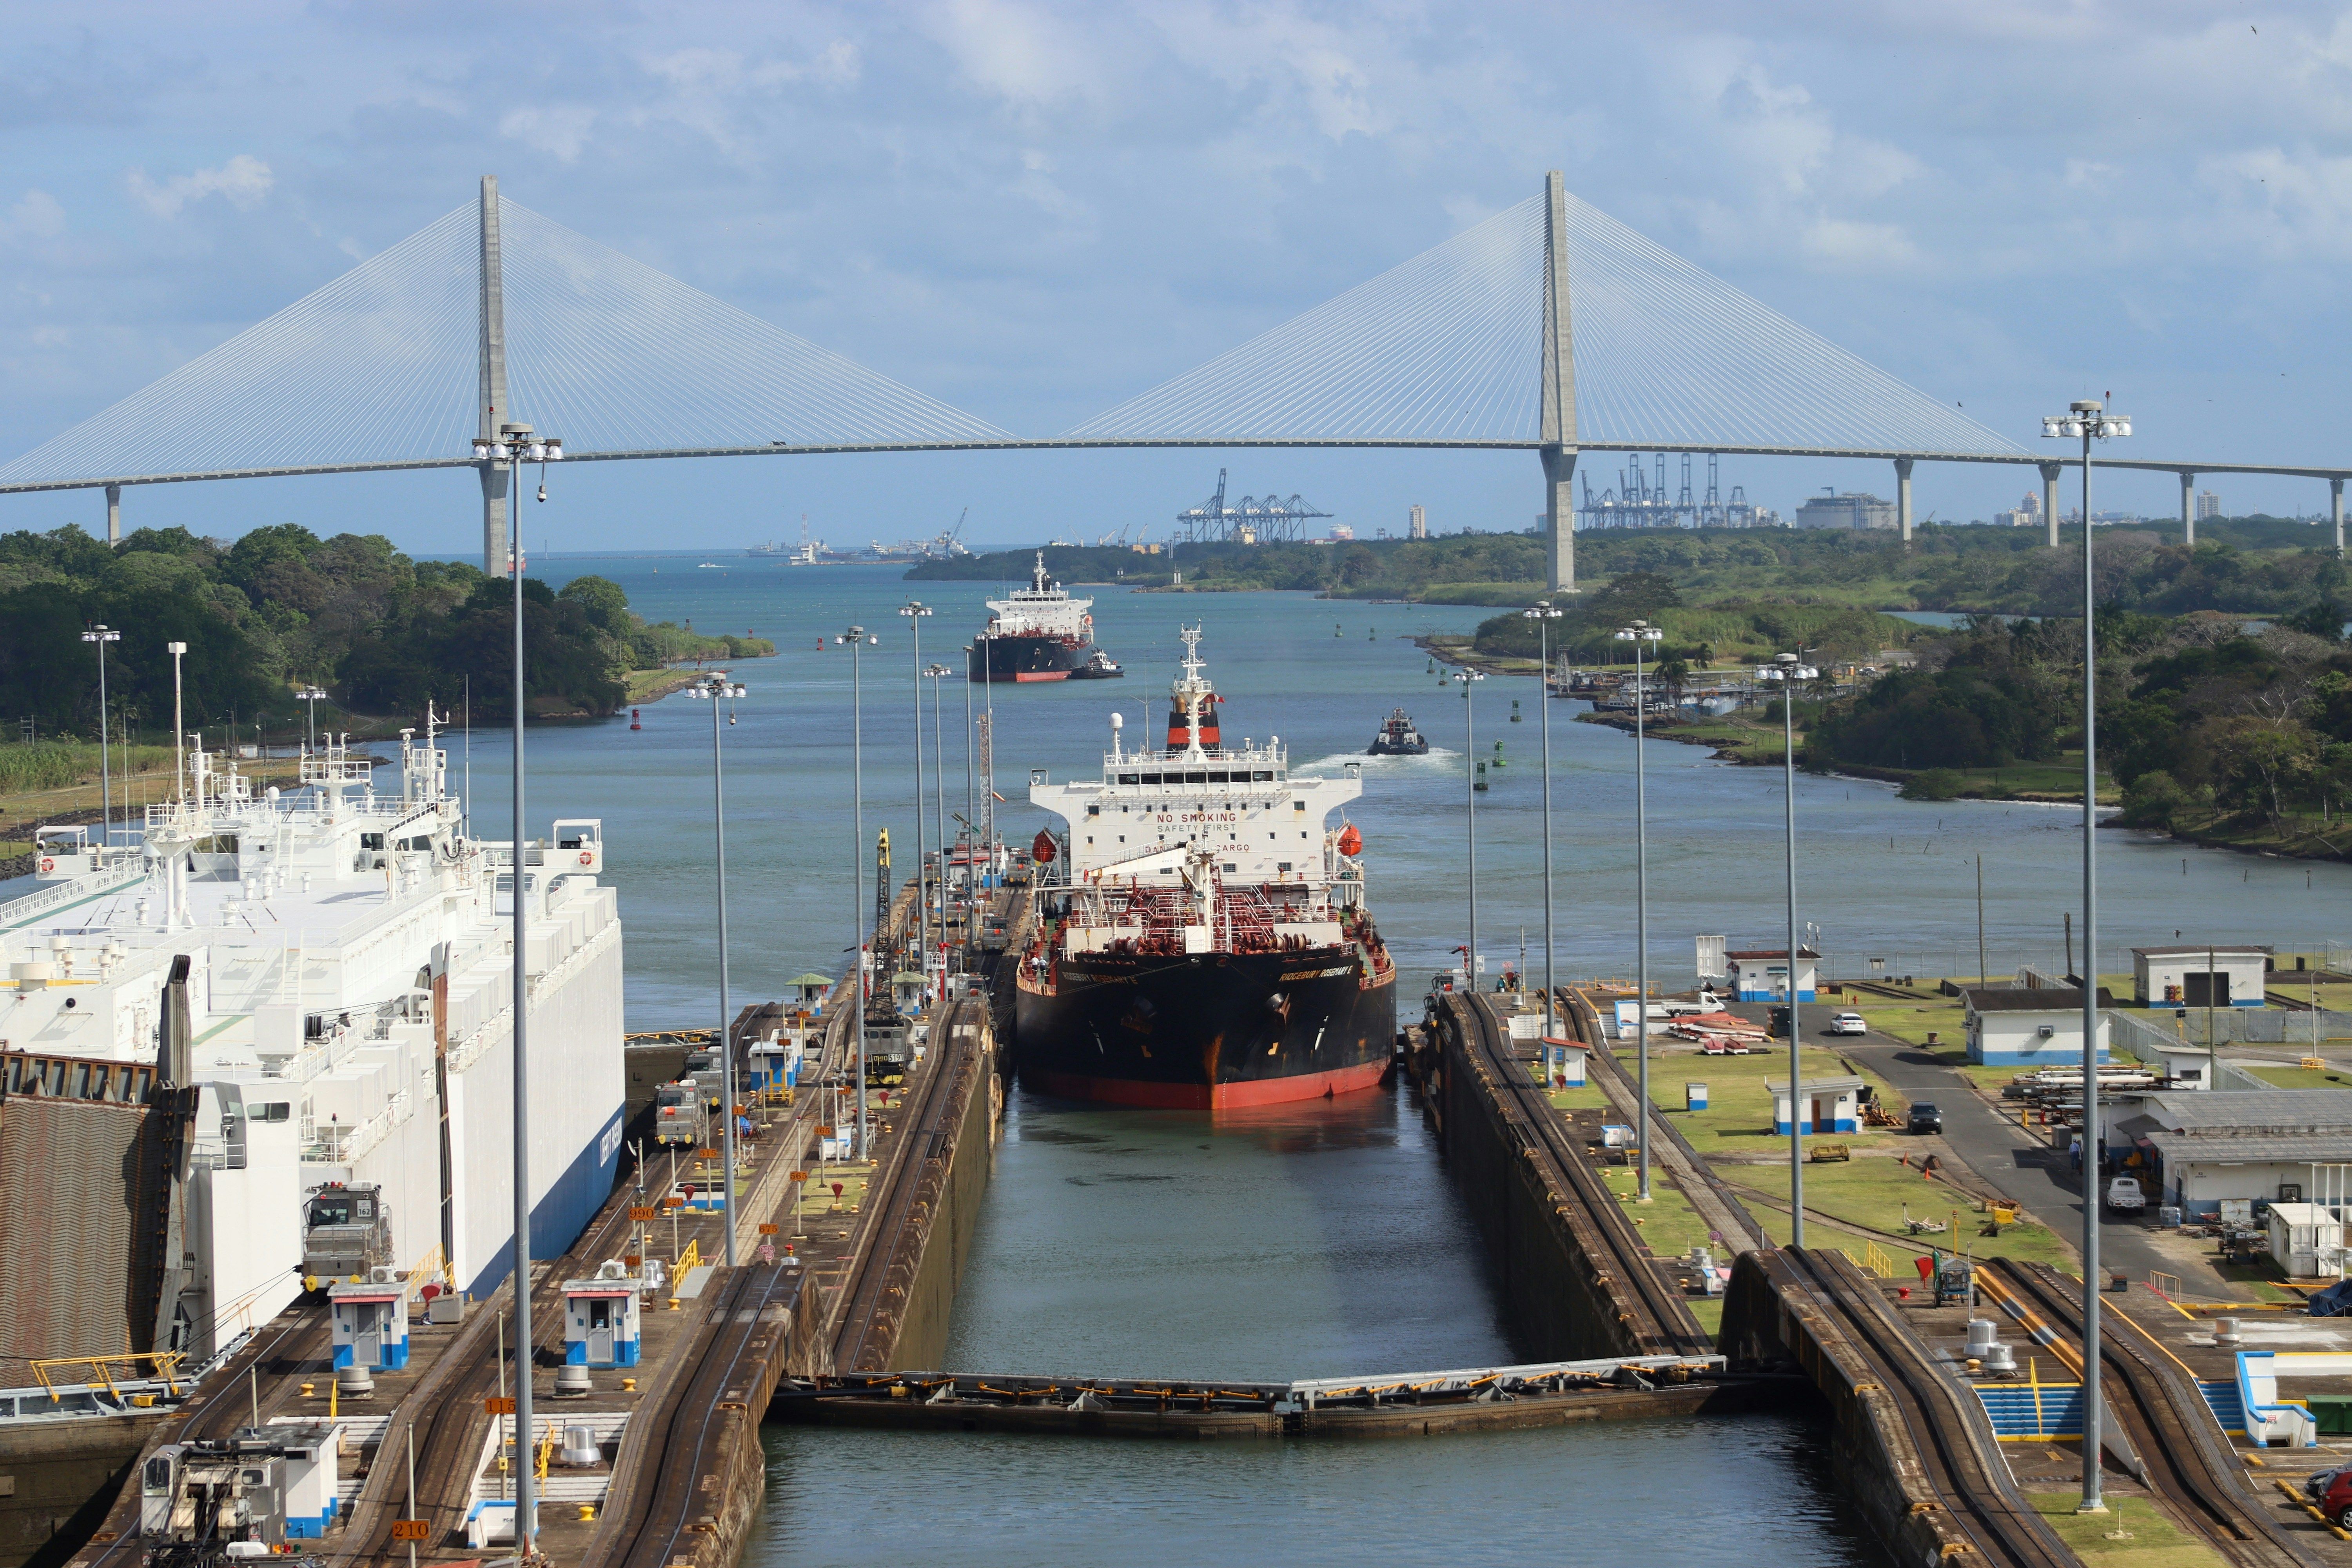
Key Facts About the Panama Canal in 2025
**Essential stats highlight the Panama Canal's engineering prowess and economic impact.**
- Length: 80 km (50 miles) from ocean to ocean.
- Annual traffic: 14,000+ ships, 5% of global maritime trade.
- Max vessel size: Neopanamax (366m long, 49m beam).
- Transit time: 8-10 hours average.
- Employment: 9,000 workers; GDP contribution: 6% of Panama's economy.
These figures underscore its unmatched efficiency in international shipping.
History of Panama Canal Expansion Projects
**The Panama Canal's expansions have transformed global shipping routes.**
Opened in 1914, the original locks handled Panamax ships. The $5.25 billion expansion in 2016 introduced Neopanamax locks, boosting capacity by 50%.
- Pre-2016: 300m length limit.
- Post-2016: Doubled container capacity to 12,000 TEU per ship.
- 2025 updates: Digital upgrades for faster auctions and transits.
Strategic Importance of Panama Canal for Trade
**Panama Canal optimizes time and fuel costs in global shipping routes.**
It links East Asia to U.S. East Coast and Europe to West South America.
| Route | Without Canal (Days) | With Canal (Days) | Savings |
|---|
| Asia-US East Coast | 45 | 22 | 23 days |
| Europe-West S. America | 30 | 15 | 15 days |
| US Gulf-Asia | 40 | 20 | 20 days |
This efficiency drives $270 billion in annual direct trade.
2025 Panama Canal Challenges and Disruptions
**Droughts pose the biggest 2025 threat to Panama Canal operations.**
El Niño reduced water levels, limiting daily transits from 38 to 24 ships in 2024. 2025 forecasts predict ongoing scarcity without major rain.
- Water use: 52 million gallons per transit.
- 2025 mitigation: Water-saving basins, higher fees.
- Impact: Delays add $100K+ per day per vessel.
How Panama Canal Affects Freight Rates
**Panama Canal congestion directly hikes global freight rates.**
- Monitor transit auctions: Slots sell out fast during peaks.
- Plan alternatives: Suez or Cape routes add 10-20% costs.
- Track water levels: Panama Canal
- Optimize cargo: Lighter loads for shallow drafts.
- Hedge with insurance: Delay clauses cover disruptions.
Panama Canal vs. Alternative Shipping Routes
**When Panama Canal restricts, alternatives strain global shipping routes.**
- Suez Canal: Red Sea risks make it unreliable.
- Cape of Good Hope: +12 days, +30% fuel.
- Arctic Routes: Ice limits, high insurance.
- Rail/Overland: US intermodal from West Coast viable but slower.
2025 case study: Droughts rerouted 20% of Asia-US traffic, spiking rates 15%.
Future Outlook for Panama Canal in Global Trade
**Sustainability investments secure Panama Canal's role through 2030.**
No WCO revisions until 2027, but 2025 national water policies demand adaptation. New reservoirs and AI scheduling aim for 40 daily transits.
FAQ: Panama Canal and Global Shipping Routes
Quick answers to common questions on Panama Canal logistics.
- What percentage of world trade goes through Panama Canal? About 5%, or 270 million tons annually.
- How long is Panama Canal transit in 2025? 8-10 hours, weather permitting.
- Why Panama Canal facing issues in 2025? Droughts limit daily ship passages due to low freshwater levels.
- What is Neopanamax ship size? Up to 366m long, 49m wide, 15m draft.
- Panama Canal fees 2025? Vary by size; largest ships pay $1M+ per transit.
- Alternatives if Panama Canal closed? Cape Horn or Suez, adding 10-20 days.
- Impact of Panama Canal on freight costs? Congestion raises spot rates 25%.
- Panama Canal water management 2025? New basins recycle 40% of lock water.
- Who controls Panama Canal? Panama Canal
- Future expansions planned? Digital upgrades and reservoirs by 2028.
Resources for Global Shipping Optimization
For real-time Panama Canal updates and route planning, tools like FreightAmigo provide insights. Book a Demo to explore options.
Contact: HKG +852 24671689 | CHN +86 4008751689 | USA +1 337 361 2833 | GBR +44 808 189 0136 | AUS +61 180002752 | Email: enquiry@freightamigo.com
 Express
 Document
 Parcel - Air/Sea
 Container
 Relocation